I’m working with PyQt5 to make a GUI for a Csound instrument, and I’m looking for a good solution for plotting real-time audio signal data. Plotting the waveform of a microphone input is an example.
It appears I have the options of either 1) pulling the microphone signal data out of Csound into Python for plotting or 2) using a Python package like PyAudio or sounddevice to pull data directly from the system audio inputs.
For those of you with experience making Csound GUIs, which of these options would you prefer and why?
I’m not much of a Python guy, but I would definitely grab the data directly from Csound using ctcsound. Once you have the data you can plot it any way you like. The beauty of this approach is you can plot any signal, not just that which is going to the audio devices.
Thanks so much for the response, Rory. Your reasoning makes good sense. I took your suggestion and have been pulling data from Csound with ctcsound. So far I’ve been able to plot a scrolling waveform of the microphone input by with the .controlChannel() method. Works beautifully!
What if I wanted to plot audio data based on arrays in the current buffer rather than from .controlChannel()? This would give me more visualization options.
Can anyone recommend ways to do that with ctcsound running Csound in a performance thread? I know the ctcsound cookbooks offer examples of how to do various things, but I haven’t seen examples that pull data from the audio buffer to make visualizations.
Here’s an update. I’m using PyQt5 to build the GUI and pyqtgraph to handle the plotting, which is supposed to be more performant than matplotlib in a real-time context.
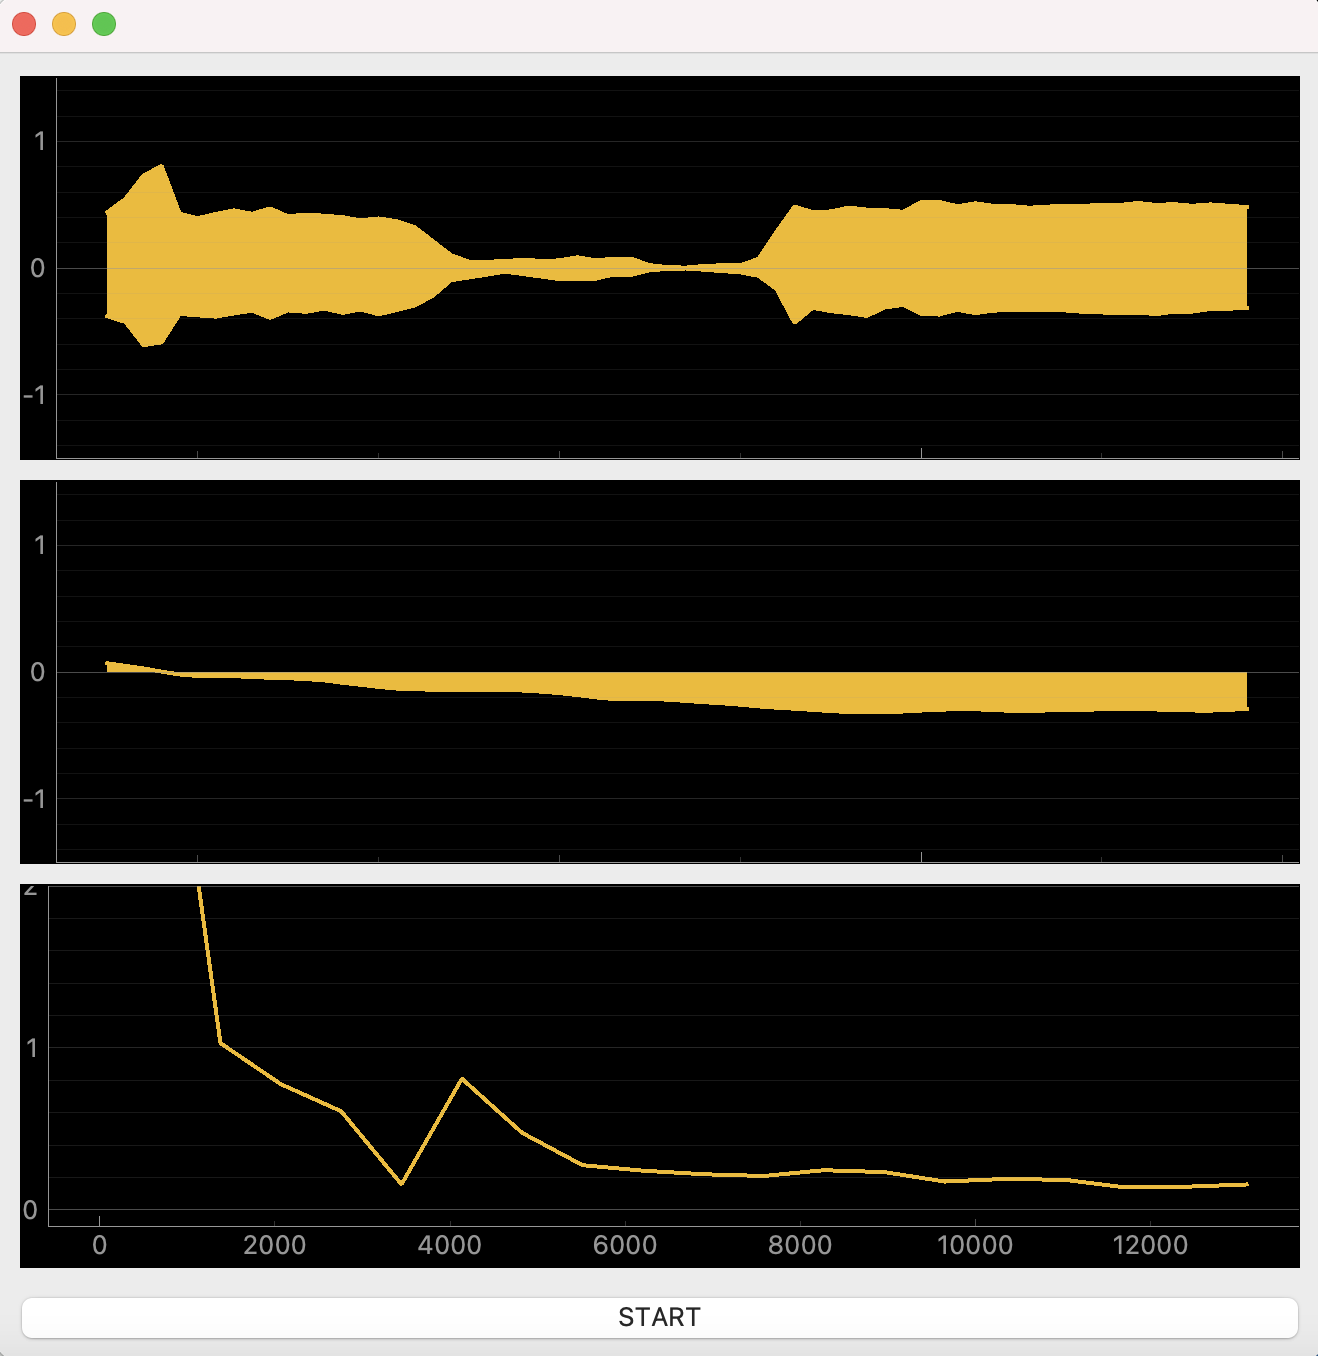
Above is a screenshot. The first plot is a scrolling waveform that pulls amplitude data out of Csound with .controlChannel() about 100 times/second. It works very well.
The second plot is also a waveform, but the amplitude data is pulled from Csound with .inputBuffer() about 100 times/second. It also works well, but my Csound buffer is set to 64 samples to reduce latency for live performance. As a result, a very small snippet of the waveform is displayed. It would be preferable to have a longer array of samples to display.
The third plot is a spectrum analysis. It uses the same .inputBuffer() data as plot #2 but runs an FFT calculation on it with numpy. This seems to work, although I’m not sure I’m doing it correctly because I haven’t worked with FFT and plotting before. However, I’m wondering if a 64 sample array is good for a spectrum analysis. It seems small to me. Would a larger array be preferable?
Let’s say I want access to larger continuous sample arrays but I can’t increase the buffer size for latency reasons. Is this the best option? Or maybe there’s a better way?
Write audio arrays in Csound to an array of size 1024, for example.
Once the 1024th sample is written to the array, send it out through a control channel.
Start writing to the array again from the beginning. Send out when full again. Repeat.
In Python, periodically pull the array from the control channel and plot accordingly.
I wouldn’t be surprised if you can access array data directly in ctcsound. I’m almost certain you can access tables, so if you keep writing the data to a table you should be able to access it in realtime.
Yes, I see that there’s a .table() method in ctcsound that accesses the values in a table. Maybe this is a better approach:
Create a table of size 1024, set initial values to zero.
Every k-cycle, shift the table to the left by ksmps (i.e. remove the first ksmps values) and write the k-cycle’s audio array to the end of the table.
That means that at any given moment it’s safe for Python to access and display the table, right? My concern with the previous approach I outlined was that I’d have to be careful about when Python could access the array. If I accessed it before it was fully written I’d get discontinuous audio signal data.
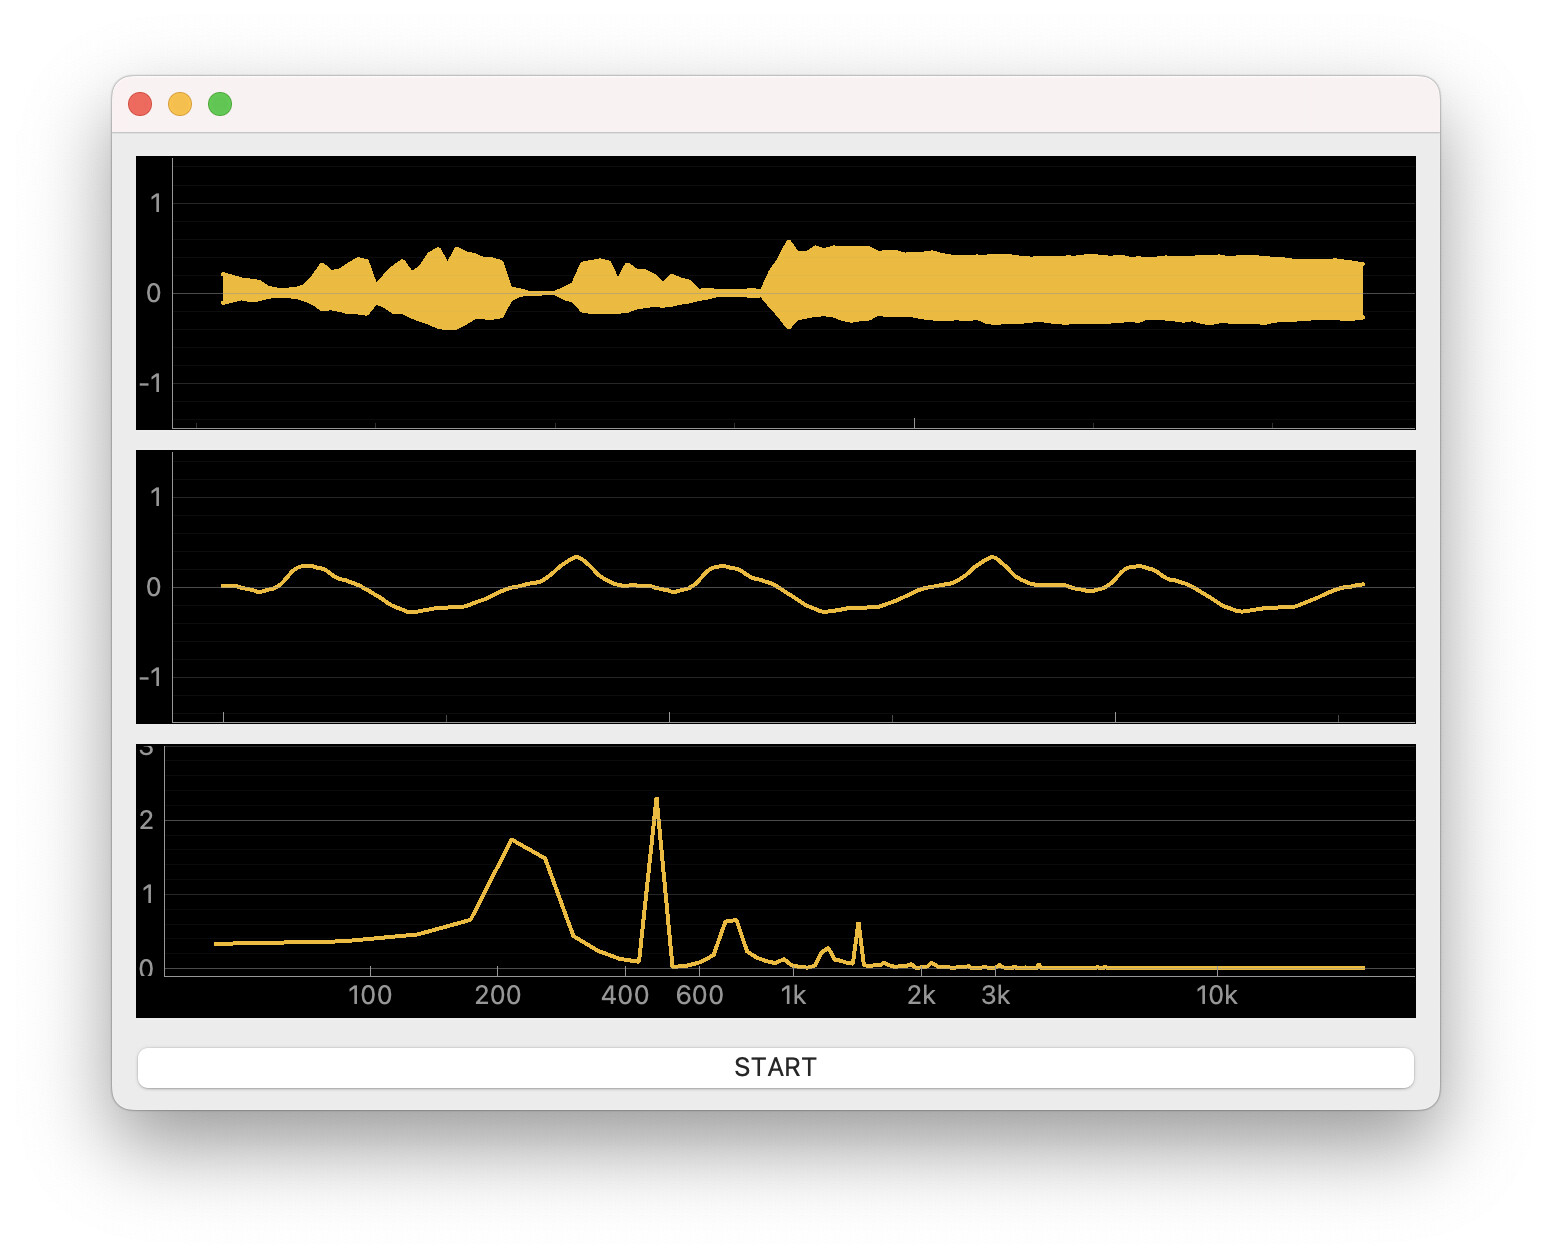
In Python I then access the table data with ctcsound’s .table() method. An array of 1024 samples does indeed produce much better waveform and frequency spectrum plots than the 64-sample array I was pulling from the input buffer earlier, and the plotting speed with PyQt5 and pyqtgraph is very fast.
Looks very nice. I wish I had more time to go through the ctcsound stuff. I was following it using Victor’s book a while back and was very impressed, but Python is just not a language I have time to invest in these days
As a novice programmer Python is great for me, and ctcsound makes controlling Csound so accessible. I actually wish I could work in C++ because that seems to be the standard language for audio software, but the learning curve drives me away. We’ll see how much mileage I get out of Python and ctcsound. Might be all I need.
I’m jumping into discussion a bit late but it is possible to access Csound input and output audio buffers directly via ctcsound using spin() and spout() respectfully. But using table as you did (@JasonHallen) has its own advantages I would say.
Calculate as much as you can in Csound and then use Python for plotting the results
There are some nice frontends that are a good choice for designing GUI when working with Csound (Frontends | Csound Community) but this also depends on application that you are building
Thanks for chiming in! It’s nice to have discussion here.
I had tried using .spin() and .spout() as well, but in my case those have a size of 32 samples, which is still too small for what I wanted to do. Creating an internal buffer of continuous audio data of whatever size I choose was the best solution I could think of, but I’m still open to other solutions!
Yes, CsoundPerformanceThread is crucial in my case because I’m building a GUI for real-time interaction with Csound and need to run Csound in a non-blocking way.
For your second point, I’m currently calculating the FFT with SciPy in Python, so it may be faster to calculate the FFT in Csound and pull that data into Python. I’ll look into that. For now, my Python GUI is running really fast. I’m getting just under 60 frames per second with the plotting. However, we’ll see how fast the program is once the complexity grows. I expect to run into speed issues down the line.
I’ve worked a lot with CsoundQt and Cabbage in the past and love them. Especially for building GUIs Cabbage is incredible. Plus, Rory is the patron saint of Csound newbies and has been so helpful to me, this thread being no exception. In my case I’ve switched to building my own GUIs for complete control and flexibility. And also as an exercise in learning more about programming and application design.